Normal distribution calculator
Enter mean, standard deviation and cutoff points and this calculator will find the area under standard normal curve. The calculator will generate a step by step explanation along with the graphic representation of the probability you want to find.
Tutorial
What is normal distribution?
The normal distribution is characterized by two parameters.
The first one is the mean of a distribution; the graph is always symmetric about the mean, which means that half of the observations are greater than mean and half are lesser.
The second parameter of a normal distribution is the standard deviation, which determines the dispersion of data around the mean. If the standard deviation is large, then the data are more dispersed, and vice versa.
68% of observations are one standard deviation distant from the mean, while 95% are two deviation above or below the mean.
Normal distribution – solved problems
Case 1: Calculate the area ABOVE a certain value.
The average height of 18-year-olds is μ = 165 cm with a standard deviation of σ = 8 cm. Find the percentage of 18-year-olds who are taller than 175 cm.

The z-score is:
z = (x - μ)/σ = (175 - 165)/8 = 1.25
Note that
P(X > 175) = P(Z > 1.25) = 1 - P(Z < 1.25)
Use standard normal table to get P(Z < 1.25) = 0.8944. So,
P(X > 175) = 1 - 0.8944 = 0.1056
Case 2: Calculate the area BELOW a certain value.
Rainfall in some area follows a normal distribution, with a mean of 250 mm and a standard deviation of 25. What is the probability that rainfall will be below 220 mm?
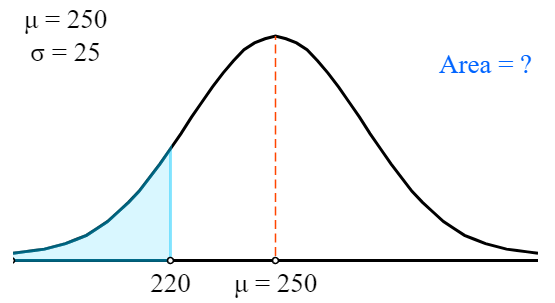
Like in the last example, we must first determine the z-score.
z = (x - μ)/σ = (220 - 250)/25 = -1.2
Now we use standard normal table to get:
P(X < 220) = P(Z < -1.2) =
= 1 - P(Z < 1.2) = 1 - 0.8849 = 0.1151
Case 3: Find an area BETWEEN two values.
IQ is normally distributed with a mean of 100 and a standard deviation of 16. What percentage of people have an IQ between 80 and 112.

In this example we need to find z-score for both cutoff point.
Z1 = (x - μ)/σ = (80 - 100)/16 = -1.25
Z2 = (x - μ)/σ = (112 - 100)/16 = 0.75
Now we use standard normal table to get:
P(80 < X <112) = P(-1.25 < Z < 0.75) = 0.6678
The video below shows how to calculate the area between two values.
Why normal distribution is important?
Real-world data very often follow the normal distribution. Thus, it is mainly used in:
1. Population studies. Almost each characteristic, such as height, leaf length and weight, of plant, animals and humans follow the normal distribution.
2. measurement errors
3. modeling in finance
1. Normal distribution explained — video lesson
2. Normal distribution tutorial — with solved examples